Overview of Lead Source Study
- Total non-paid leads grew, and almost every channel brought in more patients than the period before.
- Organic search still sends the most leads. Its share slipped 12.20% as faster channels grew around it.
- Direct jumped 23.51%, and a chunk of that growth is likely AI traffic the tools didn’t properly label.
- AI Assistants grew 55.10%, the fastest climb in the study, from the second-smallest base.
- Referral directories lost 14.39% of their share, the steepest drop anywhere in the data.
Is AI worth your marketing budget? Depends entirely on who you ask…
Organic search traffic isn’t what it was a few years ago, and sure, we could blame AI Overviews and go home. But what’s the real story?
The people selling GEO retainers say traditional search is finished. Get cited in ChatGPT before your competitors do or lose out.
The people selling classic SEO retainers say AI is a distraction. Search still feeds the answers underneath, so keep running the 2021 playbook and let the hype die on its own.
Both answers get sold with total conviction. Both answers come from the same people who invoice for the fix.
So I stopped reading vendor posts all over social media and started analyzing lead data.
Can You Even Trust Attribution Data?
Short answer: No. Not the way it gets presented to you.
No two tools measure the same way. Every GA4 property has a bucket labeled “Direct” where it files whatever it can’t explain… which means every attribution report you’ve ever read contains a percentage nobody can account for.
And the tools see less every single year.
A patient now meets a consent wall before they meet your practice. Two buttons, Accept or Deny, each with its own sub-menu, plus a “Manage Preferences” screen listing 214 “trusted partners” no patient has heard of.
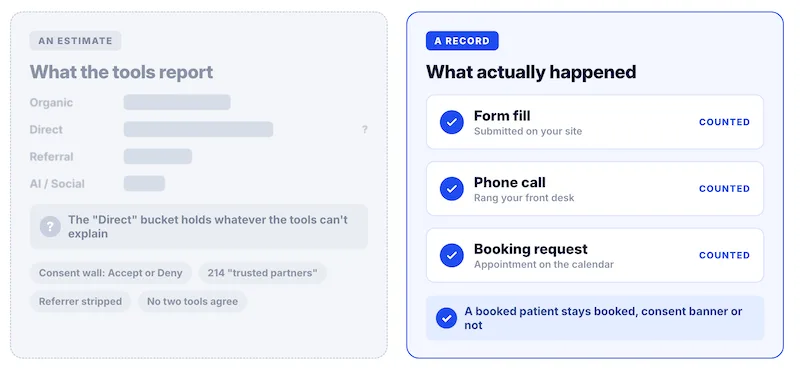
Nobody reads it. Your patients click whichever button is bigger, because they came to find out if you take their insurance.
Hit Deny? The tracking records nothing. No source, no session, no trail.
Hit Accept? Nobody knows what got agreed to… probably everything except where the lead came from.
Which puts BOTH arguments in the same position: The charts on each side come from tools that just admitted they can’t see.
But a patient who books on your site is still a patient who booked on your site. A form fill is a fact. A phone call is a fact. A booking request is a fact, consent banner or not.
Attribution is an estimate. A booked patient is a record.
Our Methodology
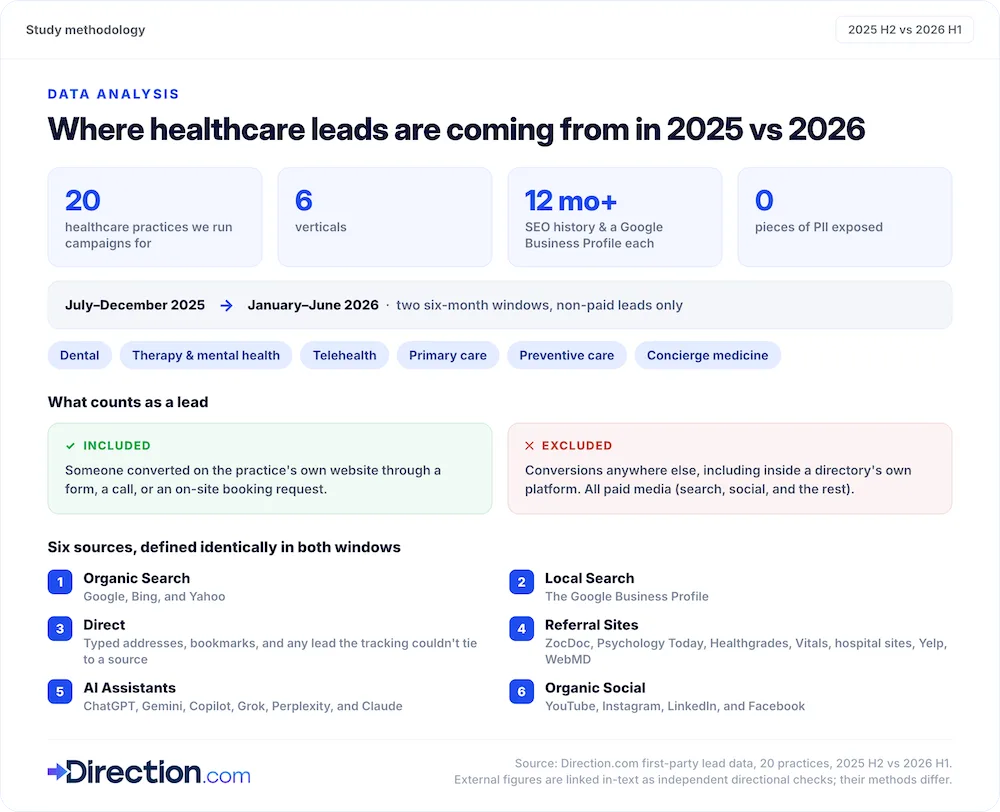
So we counted the records: every non-paid lead from 20 healthcare practices we run marketing campaigns for, across two six-month stretches. Every practice in the dataset:
- Had run an SEO campaign with us for at least 12 months
- Has at least one Google Business Profile
This is first-party healthcare lead generation data, with zero PII exposed, across six verticals, comparing the second half of 2025 (July through December) against the first half of 2026 (January through June).
- Dental
- Therapy and mental health
- Telehealth
- Primary care
- Preventive care
- Concierge medicine
Definition of a lead in this dataset: someone converted on the practice’s own website through a form, a call, or an on-site booking request.
What the data excludes:
- Conversions that happened anywhere else, including inside a directory’s own platform
- Paid media (search, social, etc.)
Six sources, defined identically in both time comparisons:
- Organic Search. Google, Bing, and Yahoo.
- Local Search. The Google Business Profile.
- Direct. Typed web addresses, bookmarks, and any lead the tracking couldn’t tie to a source.
- Referral Sites. ZocDoc, Psychology Today, Healthgrades, Vitals, hospital websites, Yelp, and WebMD. A referral lead started on one of these sites, then clicked through and converted on the practice’s own website.
- AI Assistants. ChatGPT, Gemini, Copilot, Grok, Perplexity, and Claude.
- Organic Social. YouTube, Instagram, Linkedin, and Facebook.
Every external figure cited in this piece is linked where it appears. Their methods differ from ours, so treat them as independent checks on each trend’s direction, nothing less, nothing more.
What The Data Tells Us
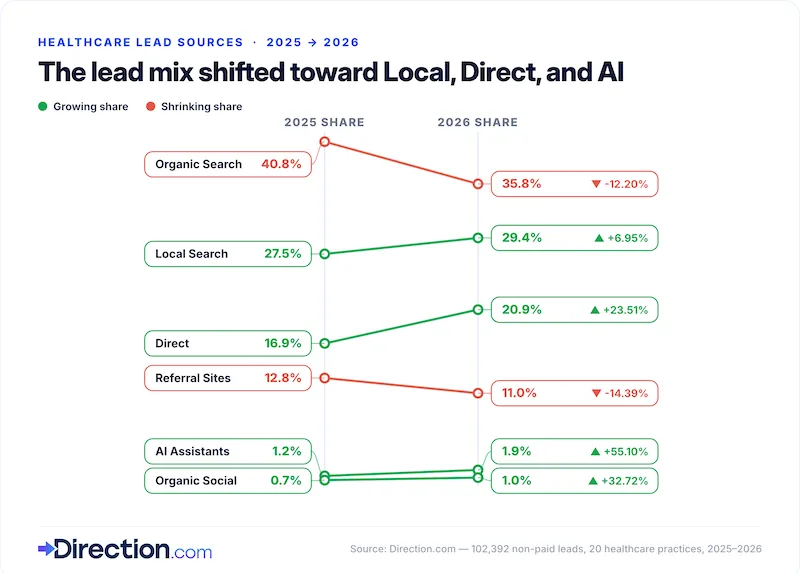
Total leads GREW. Online marketing channels are performing better in 2026 than I’ve ever seen them perform before. Kinda goes against all this hype I’ve been seeing on the internet acting like SEO is dying. But hey, I’ve been hearing that for over a decade. I’m more the type to believe what I see with my own eyes, and the data is quite telling.
So to compare the mix fairly, we scaled each stretch to the same 51,196 leads. Every number below is a share of that mix, as a percentage. A channel can gain real leads and still show a minus sign… and organic search is about to be the clearest case of exactly that.
Here’s the full picture, every channel, both timeframes, side by side.
| Source | Share in 2025 | Share in 2026 | Change in share* |
|---|---|---|---|
| Organic Search | 40.8% | 35.8% | ▼ 12.20% |
| Local Search (Google Business Profile) | 27.5% | 29.4% | ▲ 6.95% |
| Direct | 16.9% | 20.9% | ▲ 23.51% |
| Referral Sites | 12.8% | 11.0% | ▼ 14.39% |
| AI Assistants | 1.2% | 1.9% | ▲ 55.10% |
| Organic Social | 0.7% | 1.0% | ▲ 32.72% |
| Total | 100% | 100% | n/a |
*Each channel's change is measured against its own starting share. Organic slipped from 41 to 36 leads per 100, and 5 of 41 is the 12% drop.
1. Less Clicks, But More Conversions
Organic search lost 12.20% of its share between the two time periods.
BUT… organic brought in MORE leads than before. Its share fell only because other channels grew faster around it.
AI Overviews may affect lead share. The lead totals alone can’t tell us how much AI changed search behavior.
My hypothesis is that AI answers may satisfy some people before they visit a website. We don’t know if those people would have booked. The click studies below test a different question.
Pew Research Center tracked 900 U.S. adults across nearly 69,000 Google searches in March 2025. With an AI Overview on the page, 8% of searches ended with a click on a regular result. Without one, 15% did. A source link inside the AI answer got clicked 1% of the time.
Ahrefs ran the same question against 300,000 keywords, and the drop got steeper. By December 2025, an AI Overview cut the click rate on the top organic result by 58%… up from 34.5% just eight months earlier.
And healthcare is the AI overview punching bag. Healthline Media reported that 45% of its tracked medical keywords returned an AI Overview by July 2024, and it seems to only be going up.
Our reported organic lead count grew while its share fell. Pew measured clicks, so its study can’t tell us which people would have booked.
AI answers may satisfy some readers. We’d need to link those searches to bookings to test that idea.
The reported 12.20% decline in organic lead share doesn’t establish which visits AI replaced or what those visitors would have done.
There’s an easy check you can do: pull booked patients against the traffic line. If patients held steady while traffic dipped, the channel is still doing its one job.
Direct and the AI channel grew fastest in our reported lead shares. Some people may read an AI answer, then reach the site through a visit tagged as Direct. That path remains a hypothesis.
Share numbers alone can’t prove causation, so treat it as a pattern to watch.
2. Direct Traffic Is a Brand Metric, Not A Channel
Direct grew its share by 23.51%, which is by far more than any other channel.
Technically, Direct means someone typed your address, used a bookmark, or clicked a link the tracking couldn’t read.
Loamly’s 2026 attribution benchmark found that 70.6% of AI-driven visits land in GA4 as Direct.
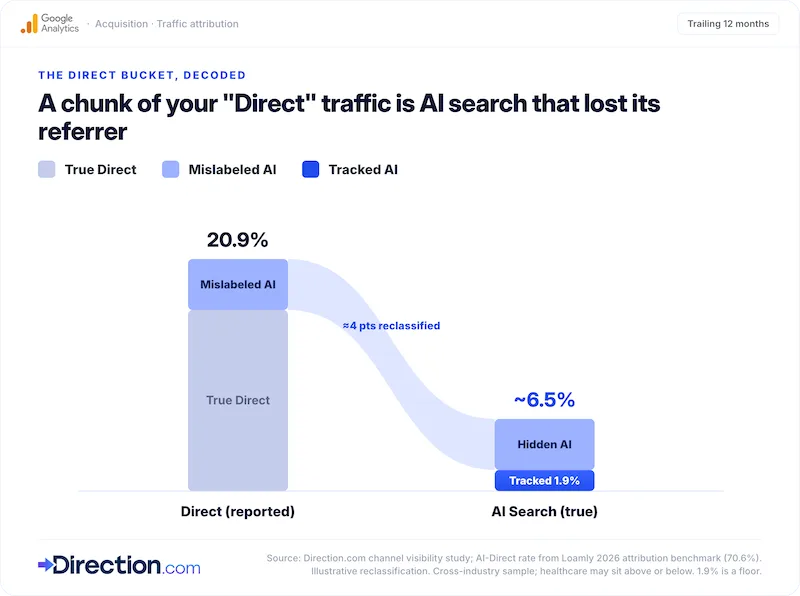
Someone reads an AI answer, then types your practice name into the address bar. The referrer never survives the trip, so the lead lands in Direct.
Our tracked AI share is 1.9%. If seven in ten AI visits arrive unlabeled, the true share sits near 6.5%, which moves about 4 points of the Direct bucket to AI.
But the mislabeling only explains HOW these leads lost their referrer. It doesn’t explain WHY the visit happened at all.
Nobody Types a Name They've Never Heard Of
A Direct lead requires the patient to already know who you are.
They heard your name in a ChatGPT answer. Saw it in an AI Overview. Read it in a Reddit thread about therapists in their city. Caught it in a Spotify ad on the commute, or heard it from a friend whose kid you treated. Then they skipped the search results entirely and typed your name.
I call it branded demand. And a 23.51% jump says branded demand grew faster than anything else in this dataset.
Charles Floate put it perfectly in his article, when he mentioned the importance of entity stacking, or, getting your brand everywhere it needs to be in order to build visibility and trust.
The Most Important Pattern, Revealed.
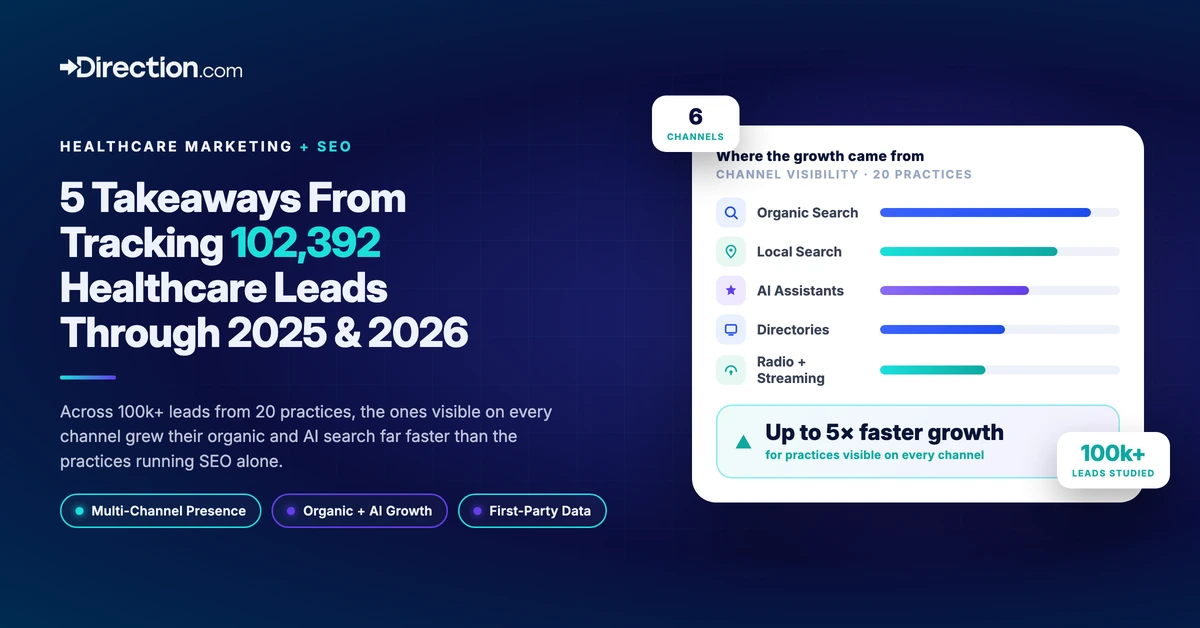
I segmented the 20 practices by channel activity. Some run SEO with us and little else. Others run multi-channel marketing campaigns: SEO, paid search, paid social, directory placements, plus advertising outside the internet entirely… Spotify, local radio, the channels most SEO reports never see.
The practices active across ALL channels posted the largest growth in Direct. And that correlated to the largest growth in both organic search and AI search.
The difference was insane.
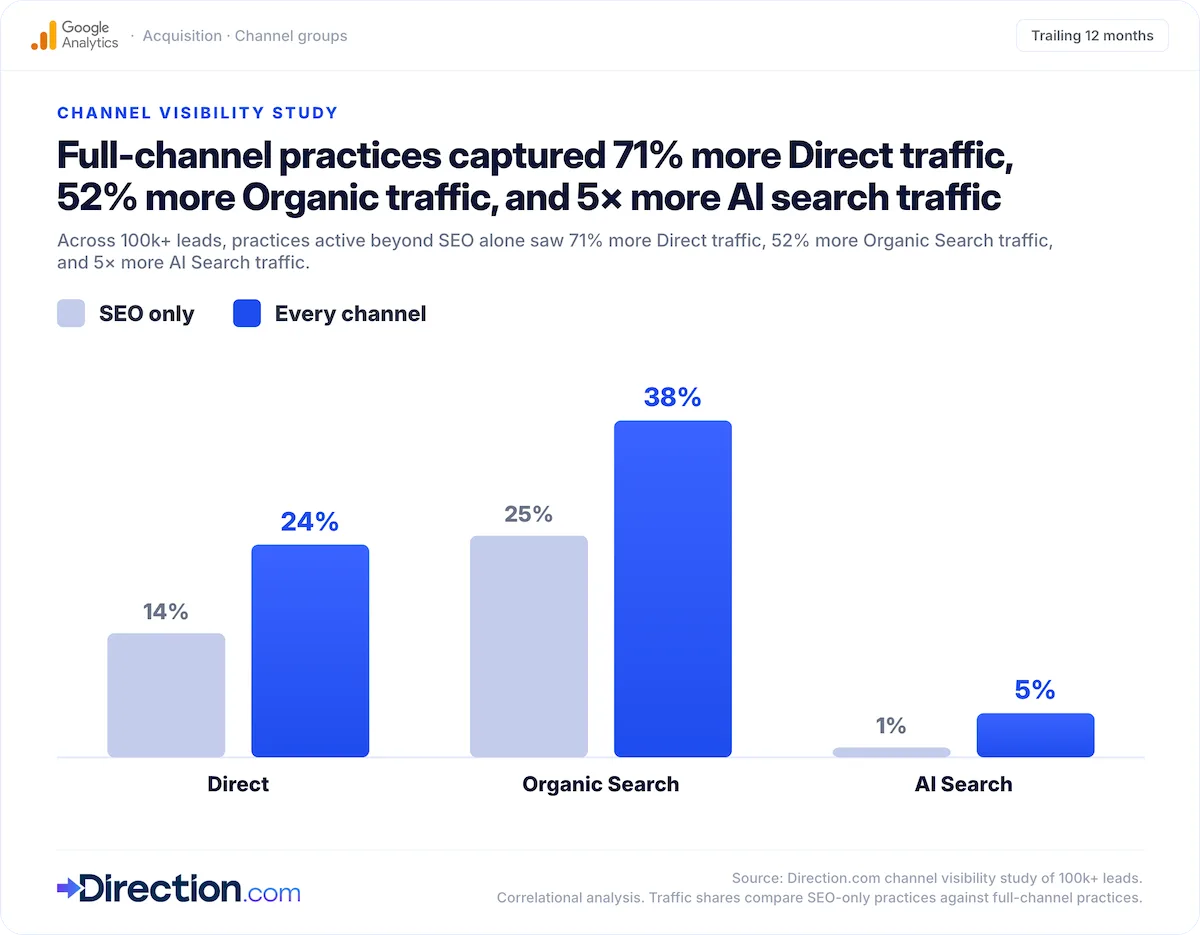
The practices that had a brand presence everywhere had sometimes double or more the growth in organic and AI search vs. the practices only running SEO campaigns, and maybe posting on Facebook here and there.
Nothing in the data was clearer to me than this. When people can find you in more places, Google can too, and your search presence in every type of search engine grows.
In short, visibility in one channel pays out in every other.
Now, I know practices running every channel also spend more overall, and 20 practices can’t isolate every variable. So, this is correlation, flagged as correlation.
And yeah, I get it. Showing up everywhere costs more. But showing up in more channels compounds the return for every other channel.
3. AI Assistants grew 55%, but I'm not impressed.
AI Assistants grew their share by 55.10%, the fastest jump in the study and by a wide margin.
It’s also the second-smallest channel: 1.9% of leads.
The usage numbers say this is early.
- OpenAI reported in January 2026, alongside its ChatGPT Health launch, that 230 million people ask health and wellness questions on ChatGPT every week. That’s 40 million people a day, and more than 5% of every message the platform handles.
- KFF’s June 2026 report found that 29% of U.S. adults used AI for health information or advice at least monthly. The survey ran May 7 to 31, 2026; roughly two years earlier, the share was 17% in June 2024.
- Google said at I/O 2026 that AI Mode passed 1 billion monthly users, with query volume more than doubling each quarter.
Our 1.9% AI lead share and KFF’s 29% monthly-use figure describe different groups. They can’t tell us what share of AI users became leads. Tracking and patient trust need study.
But, two things can be true at once. Right?
I think it’s both, depending on the situation. I’d much rather go to a LASIK doctor my friend had a successful surgery with vs trusting who GPT recommends. But I’m still going to do my research on LASIK recovery times and all in GPT.
So, yeah, a 55% jump on a tiny base is still tiny. All I’m saying is don’t be that brand that cuts its search budget to chase 1.9% of your leads because you heard the “dangers” of what’ll happen if you don’t optimize for AI search.
Better to flag a small channel that’s climbing fast than explain later why you ignored it.
So, my read? Definitely important. It’s growing. But focus on building your brand overall, and the AI search traffic will come to you.
As Kristina Bergwall puts it in her article in Search Engine Land, when you fund multiple channels, you’re investing in information sources that shape how AI systems understand and recommend your brand.
4. Directories are losing the one job they had
Referral sites lost 14.39% of their share, the steepest drop of any channel here. Recognize any of ’em?: ZocDoc, Psychology Today, Healthgrades, Vitals, hospital sites, Yelp, and WebMD.
To be clear; these are patients who started on a directory, but converted on the practice’s own website. Bookings finished inside the platforms themselves never entered this dataset.
The entire category’s traffic picture looks pretty bad. According to Lily Ray’s analysis of Google’s December 2025 Core Update using Sistrix data, Healthline lost about 30% organic visibility. The damage was concentrated across major health publishers including Cleveland Clinic and NIH.gov, where search visibility dropped as Google kept answering more health queries directly through AI-driven results.
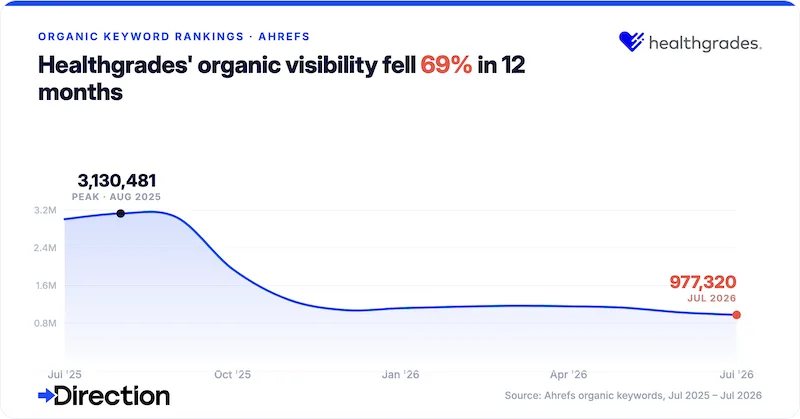
The directories can read their own traffic charts too. In December 2025, Zocdoc began powering real-time appointment booking on Healthgrades, two long-time rivals sharing one booking system. Rivals share infrastructure when a category is under pressure, and I’d say that deal looks defensive.
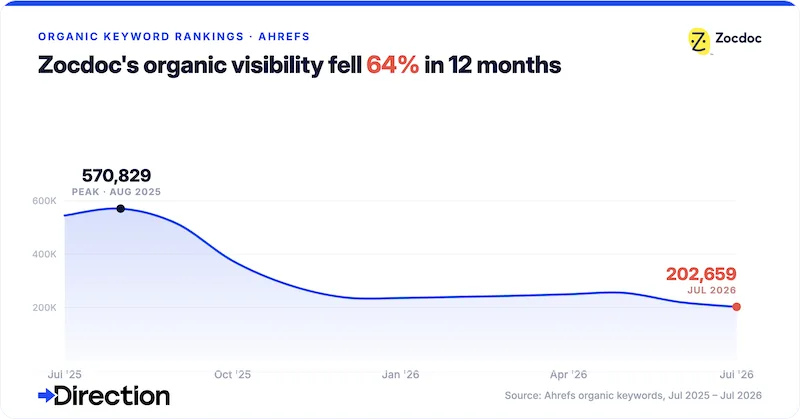
For years, a directory was the middle-man. Someone searched for a specialty, landed on Healthgrades or ZocDoc, and picked a name from the list.
Now Google’s local results and AI answers come first. Someone asks for the best therapist nearby, gets a phone number right away, and never clicks the directory.
5. Social works better than your reports admit
Organic Social grew its share by 32.72%, a healthy rate from the smallest base in the study. It now sits at 1.0% of leads (YouTube, Instagram, and Facebook).
According to Pew’s 2026 research, half of adults under 50 get health and wellness information from social media influencers or podcasts.
People watch. They just don’t click a tracked link and fill out a form in one session. So the last-click report gives the credit to search or Direct.
For most of the 20 practices, free social is closer to a rounding error than a real source of patients. Treat 1.0% as a floor any type of practice with real video can beat.
The two lead sources that somehow made an appearance
Wikipedia sent five leads this year. LinkedIn sent six.
Eleven leads is statistical noise, but new patterns always deserve a look, and I think the practice type explains it for Linkedin; concierge medicine.
A five-figure yearly membership is closer to a hiring decision than a one-off teeth cleaning.
And people research a hire differently than they research a dentist. They pull the doctor’s LinkedIn like a resume. So, to me, the research behavior matches the price tag.
If that guess holds, it says something bigger: the more a patient pays, the more they research you online before converting.
Now, the Wikipedia story is the condition researcher. Nobody looks up a practice on Wikipedia. They google conditions or surgeries, scroll to the references, and click through to a practice whose content got cited as a source. Five leads came from being the citation through the search result. Kudos to whoever did all that deep research, I can’t stand looking through a wiki page like that. But hey, just goes to prove how different people search.
Your move, channel by channel
| Channel | What the data says | Your move |
|---|---|---|
| Organic Search | Leads grew, share fell 12.20%. AI Overviews cut top-result clicks by up to 58% (Ahrefs). | Slightly increase budget as this also helps AI visibility. Informational rankings pay less per position than they did, so the same spend should move to local and commercial intent pages that still convert. |
| Local Search | Share up 6.95% while 68% of searches end without a click (SparkToro). | Increase focus. This channel gained share without extra spend, which means the ceiling sits higher than current effort. Weekly profile work returns more per hour than most line items. |
| Direct | Share up 23.51%. About 70.6% of AI visits log as Direct (Loamly). | No new budget. Direct growth is a measurement signal, not a channel to fund. Put effort into attribution so you know which channels deserve the credit hiding here. |
| Referral Sites | Share down 14.39%. Health publishers down 27% to 39% year over year (Amsive). | Cut budget. A shrinking channel with per-listing contracts deserves a smaller line. Keep the two or three directories that produce booked patients and reallocate the rest. |
| AI Assistants | Share up 55.10% from a 1.2% base. 230M weekly health questions on ChatGPT (OpenAI). | Increase effort. Fastest growth rate on the board from the smallest base. |
| Organic Social | Share up 32.72% to 1.0%. YouTube leads health content use at 29% (KFF). | Less budget than the growth rate suggests. One percent of leads does not justify a content team. Fund video in specialties where patients research visually. |
Meet Your Patients Wherever They Are, Whenever They Need You.
Eighteen months of data, six channels, one AI upheaval, and the job description never changed. Put your practice in front of the patient at the moment they need care, then make booking easy.
In 2015 that meant ranking. In 2020 it meant ranking plus a Google Business Profile. In 2026 it means being present everywhere: reviews, directories, transcripts, local coverage, and yes, still page one.
The lead sources will continue to change, but the signals underneath it won’t. Trust, corroboration, and a recognizable brand won every era of search, and this dataset says they’re winning this one too.
Don’t be the brand that chases each new acronym and spends years recovering. Ignore the panic cycle. Measure booked patients, build the time-tested signals every channel has proven to reward, and let the acronyms fight it out without you.
The 20 practices in this study are clients of our healthcare marketing agency, which runs SEO, paid search, and web design under one roof.
Our guide to digital marketing strategies for practices turns these lead-source findings into a channel plan.
The 20 practices in this study started with the same call. Book a discovery call and get your channel mix read by the team that ran the data.